


ggpubr一起来画箱图啊~

elisa

先画个简单的图
library(ggpubr)#导入包
data('ToothGrowth')#用R自带的数据ToothGrowth
ToothGrowth$dosef <- factor(ToothGrowth$dose,order=T)# 计量数据预处理为factor
ggboxplot(ToothGrowth,x='dosef',y= 'len',fill ='dosef')+
stat_compare_means(method='anova')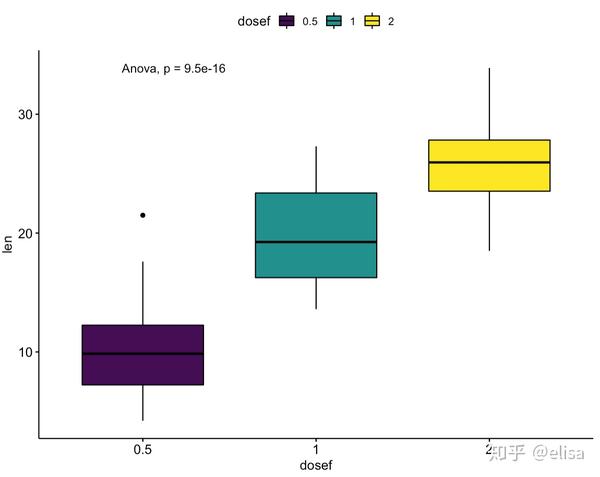
升级1. 两两比较
#写好两两比较的列表
my_compare <- list(c('0.5','1'),c('0.5','2'),c('1','2'))
ggboxplot(ToothGrowth,x='dosef',y= 'len',fill ='dosef')+
  stat_compare_means(method='anova',label.y=42,label.x = 0.6)+# 这个地方调下总pvalue的位置
  stat_compare_means(method='t.test',comparisons = my_compare)# 指定好比较的样本配对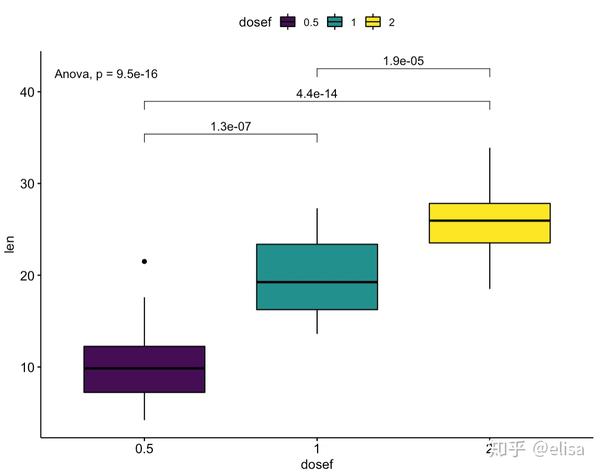
升级2. 想用 小星星 “*” 作为显著性标记?使用label = "p.signif"轻松搞定。
ggboxplot(ToothGrowth,x='dosef',y= 'len',fill ='dosef')+
  stat_compare_means(method='anova',label.y=42,label.x = 0.6)+
  stat_compare_means(method='t.test',comparisons = my_compare,label="p.signif")
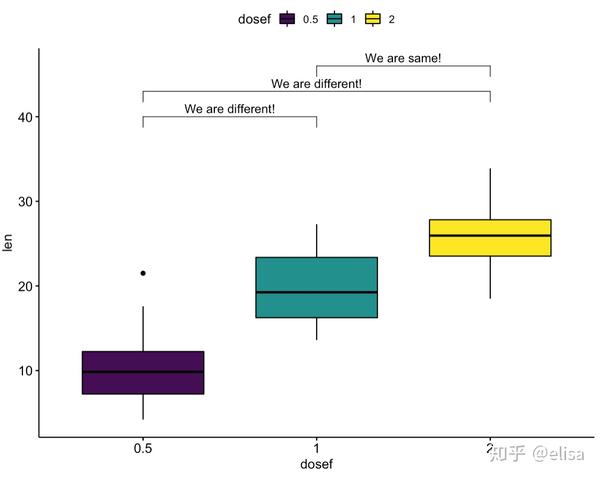
升级3. 想更改不同星号的对应的pvalue? 使用compare_means + stat_pvalue_manual!
# 使用compare_means 单独计算pvalue,并用symnum.args规定星号对应的pvalue
stat.test <- compare_means(len~dosef,ToothGrowth,
              symnum.args = list(cutpoints=c(0,0.00001,1),symbols = c("We are different!","We are same!")))
# 固定括号位置
signif.stat <- stat.test %>%
          mutate(y.position = c(40,43,46))
# 使用stat_pvalue_manual 显示事先计算好的pvalue
ggboxplot(ToothGrowth,x="dosef",y="len",fill="dosef")+
          stat_pvalue_manual(signif.stat,label="p.signif")
这个地方不能把symnum.args参数直接用在stat_ compare _means里面,会无效。不知道是不是bug,欢迎知道的老铁留言告知。
这里也可以过滤掉一部分结果,比如 只显示different的结果。只需在绘图前增加一步过滤。
stat.test <- compare_means(len~dosef,ToothGrowth,
                           symnum.args = list(cutpoints=c(0,0.00001,1),symbols = c("We are different!","We are same!")))
#只保留different的分组
signif_stat <- stat.test[stat.test$p.signif == "We are different!",]
signif.stat <- signif_stat  %>%
  mutate(y.position = c(40,43))#相应的有两个括号的位置
ggboxplot(ToothGrowth,x="dosef",y="len",fill="dosef")+
  stat_pvalue_manual(signif.stat,label="p.signif")+
  scale_x_discrete(limits = c('2','1','0.5'))

升级4. 想更改箱子的顺序?使用scale_x_discrete(limits = c(...))
ggboxplot(ToothGrowth,x="dosef",y="len",fill="dosef")+
          stat_pvalue_manual(signif.stat,label="p.signif")+
          scale_x_discrete(limits = c('2','1','0.5'))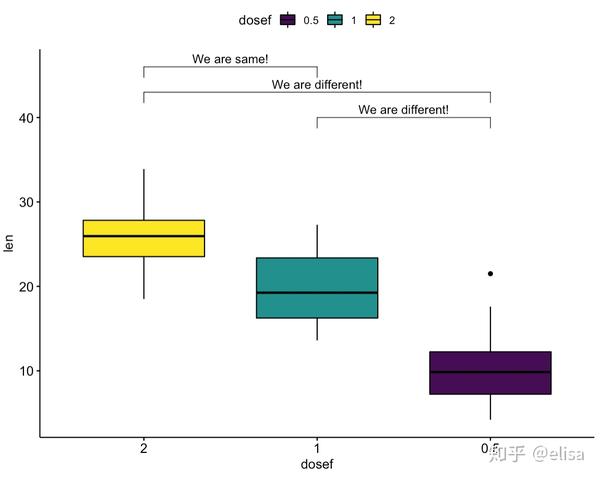
升级5. 其他美化
- 改为透明框+数据点
ggboxplot(ToothGrowth,x="dosef",y="len",color="dosef",add = "jitter")+
          stat_pvalue_manual(signif.stat,label="p.signif")+